Trading Strategy - Implied Moves
Implied moves and our Tradingview "Risk Ranges" indicators for FX and SPX explained.
‘Expected moves’ and ‘Risk ranges’ derived from option prices are a statistically grounded, market-based way to gauge volatile moves, and to set expectations and boundaries for FX price action.
This makes them useful in both risk management and trade execution, and having this in our toolbox helps to boost our edge just that little bit further. That’s why we developed a TradingView indicator to compliment our range of trading tools.
Below, we cover some basic principles to understand how the indicator is constructed, and some example on how we can use it.
‘BASIC’ PRINCIPLES
What is Implied Volatility (IV)?
IV is a reflection of volatility expectations around market risks. The higher the IV, the greater the volatility expected. IV is quoted in annualised terms meaning that if IV is 10%, the market expects the asset or currency pair to move up or down by 10% over the year.
Date-To-Expiry (DTE)
Because IV is an annualised measure, and not all options are 1-year options, DTE is a key component of how we estimate expected moves. For example, a 1 or 3-month option being quoted in annualised terms, needs to be converted into 1 or 3-month terms to estimate how much an fx pair is expected to move within that period.
Assuming that a 1-month option's IV is 10%, the market expected move is calculated by: SQRT(1/12)*10% = 2.89%. For a 3-month option it would be SQRT(3/12), and a 1-week option would use SQRT(1/52) – notice the pattern?
252-day vs 365-day model
Annualised volatility for Equities is calculated differently. It is calculated from the standard deviation of returns over a specified number of trading days, which is assumed to be 252 trading days a year using the Black-Scholes option pricing model.
For FX, the calculation involves further considerations via the Black-Scholes Garman-Kohlhagen model, which uses log-normal returns, two risk-free rates of each currency as opposed to one risk-free rate for equities, and annualised to 365-days as opposed to 252 days in equity options.
At-The-Money (ATM) Implied Volatility
We typically use ATM IV to estimate the expected move because ATM, simply refers to the option contract whose strike price is closest to the current spot price, and the IV of that option would therefore give us the best estimate of how much volatility the market is pricing in (or 'expects') from 'now'.
Expected Move in Standard Deviations (SD)
The calculated 'expected move' is considered to be 1SD, where 1SD is considered to be a probabilistic estimate of price staying within that expected range 68% of the time, or roughly 2 out of 3 times. A 2SD move would be 2x more than was expected and statistically rare to exceed expectations by that much, i.e. 2SD would be just 5% of the occurrences in a normal distribution, or 1 out of 19 times. That's the gist, and thinking in those terms is helpful to making trading decisions.
'FX RISK RANGES' INDICATOR
Practical Uses
FX is very choppy compared to other asset markets and as result, FX traders are quite often attentive to the level of volatility of various currencies at any one particular time; whether that be about which pairs to keep an eye on, judging the appropriate stop-loss level before or after certain market moves, what levels to set trailing-stops, or levels traders are planning to buy or sell in and out positions. Having a tool such as this provides useful perspective to all those scenarios.
Expected Moves > ATR
“Average True Range (ATR)” is a very popular indicator among FX traders and quite similar to the "FX Risk Ranges" indicator in terms of their practical usage. But while ATR does provide a reasonable guide to gauging volatility, it is a backward-looking measure being a historical average of volatility, whereas options implied risk ranges is forward-looking as it is based on market expectations. That makes our indicator have real practical significance, and a more relevant indication of volatility on any given trading day.
Indicator Features
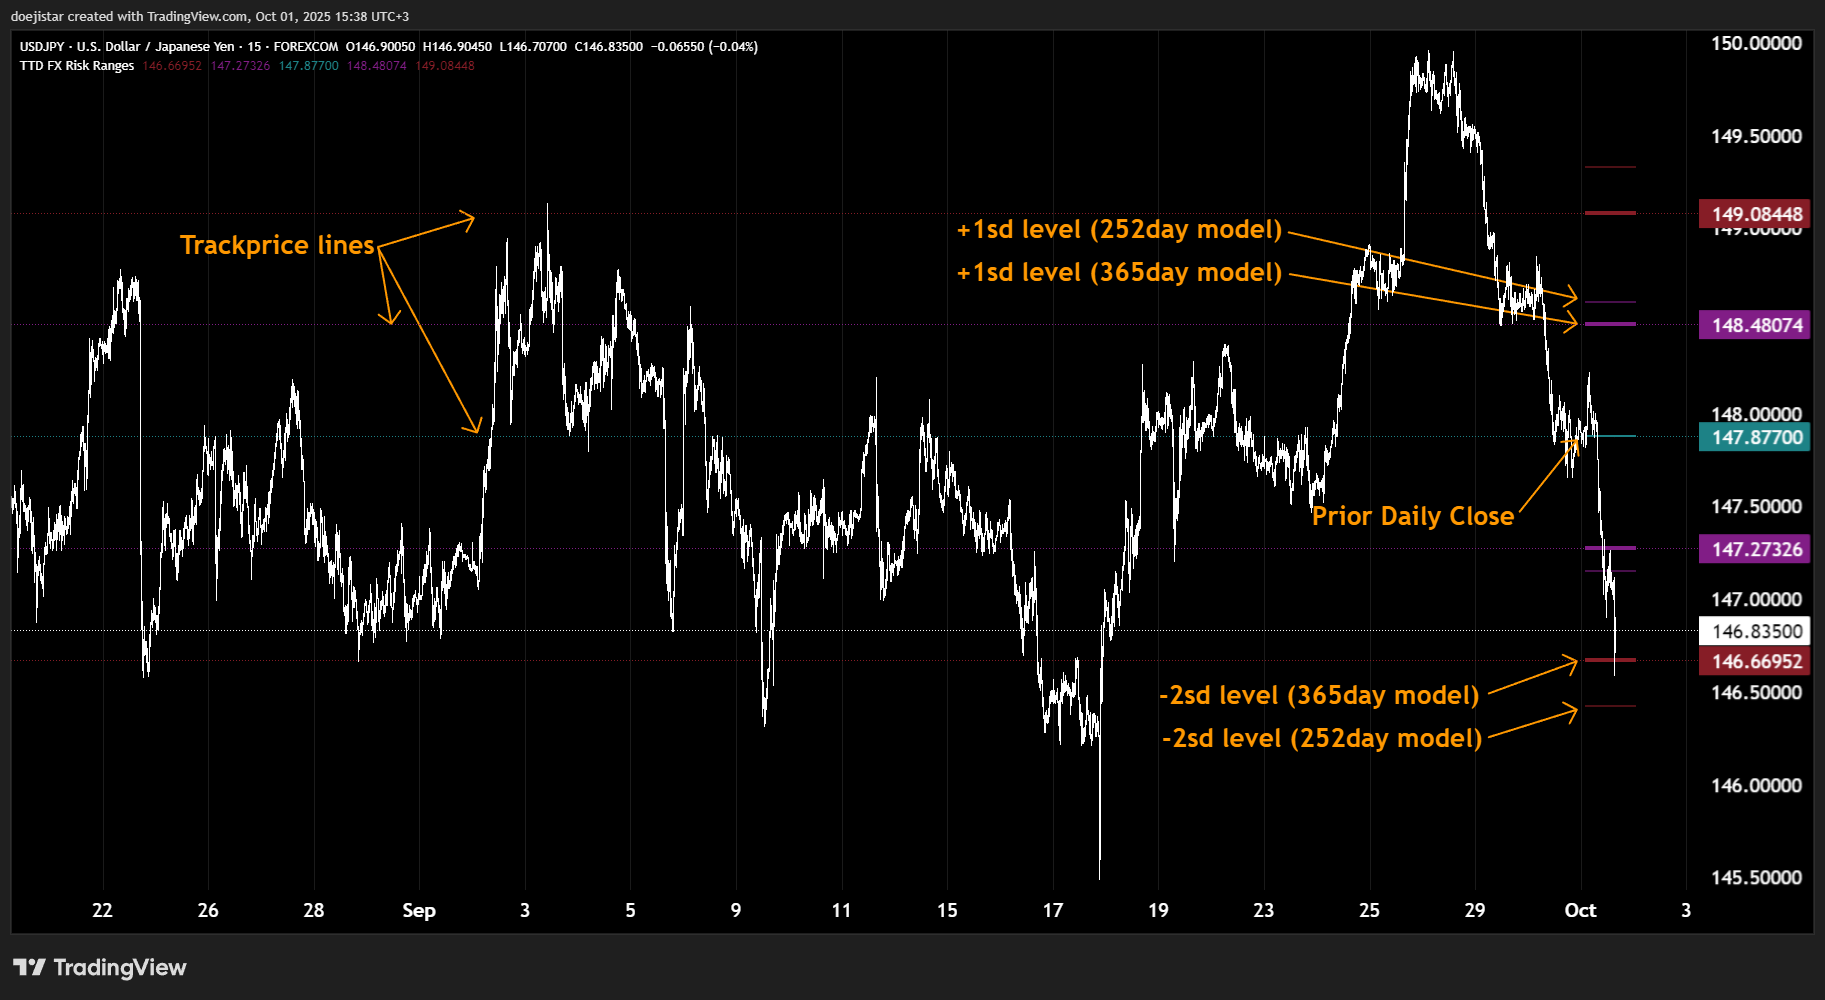
Now that we have a grasp on the basics, the indicator should be fairly straight-forward. The indicator calculates the implied range (1 standard deviation levels in Purple) that is priced in by the options market and is plotted on the chart, as well as the 2-standard deviations in Red.
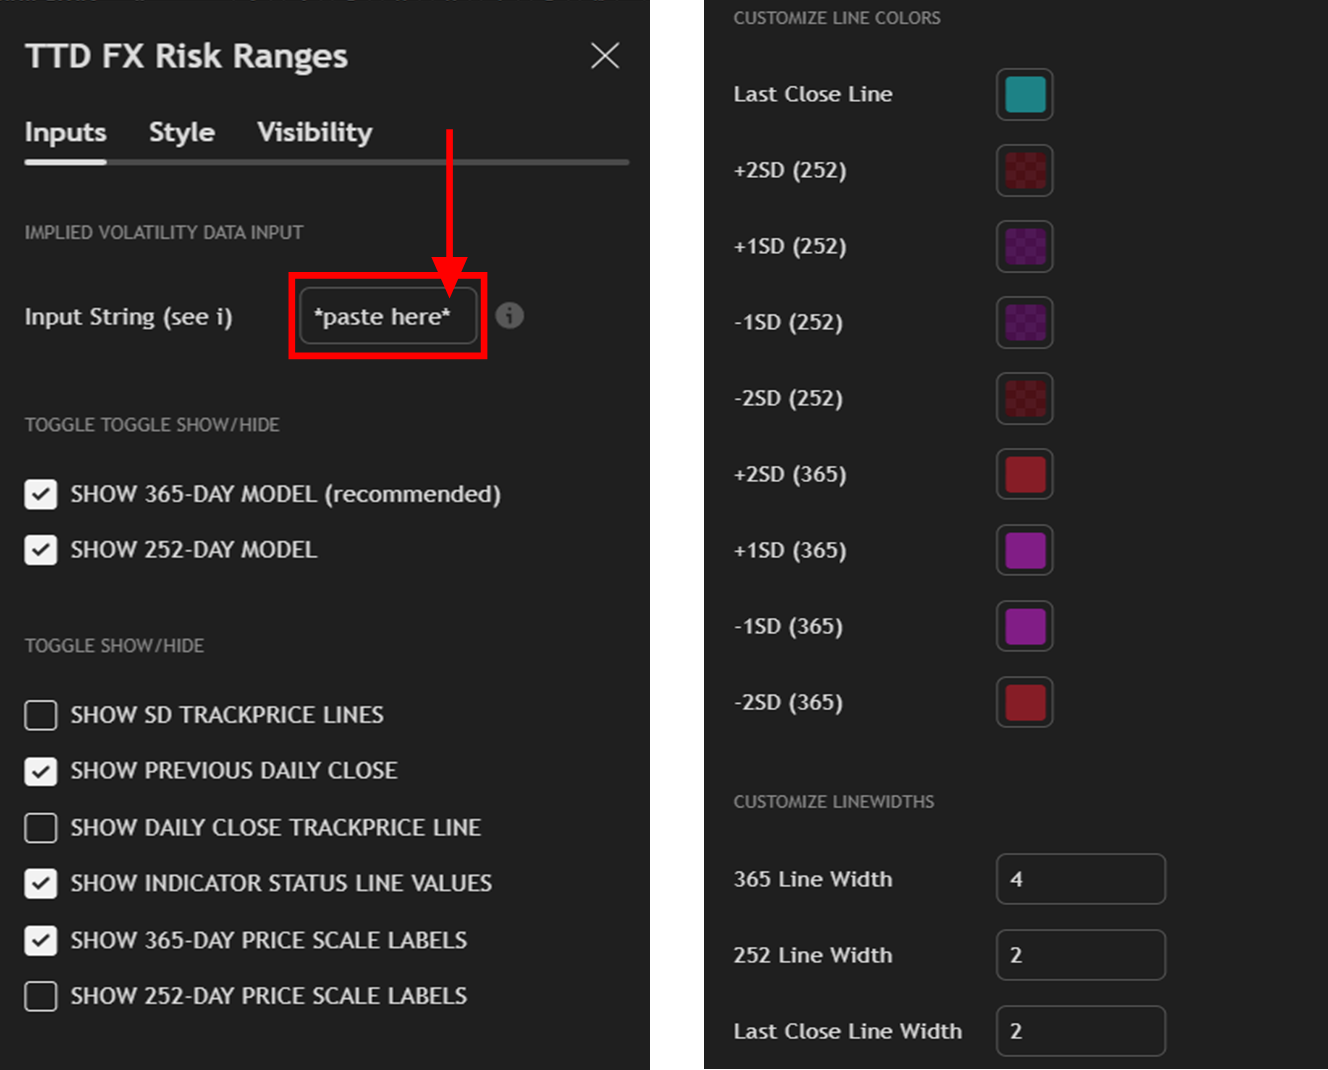
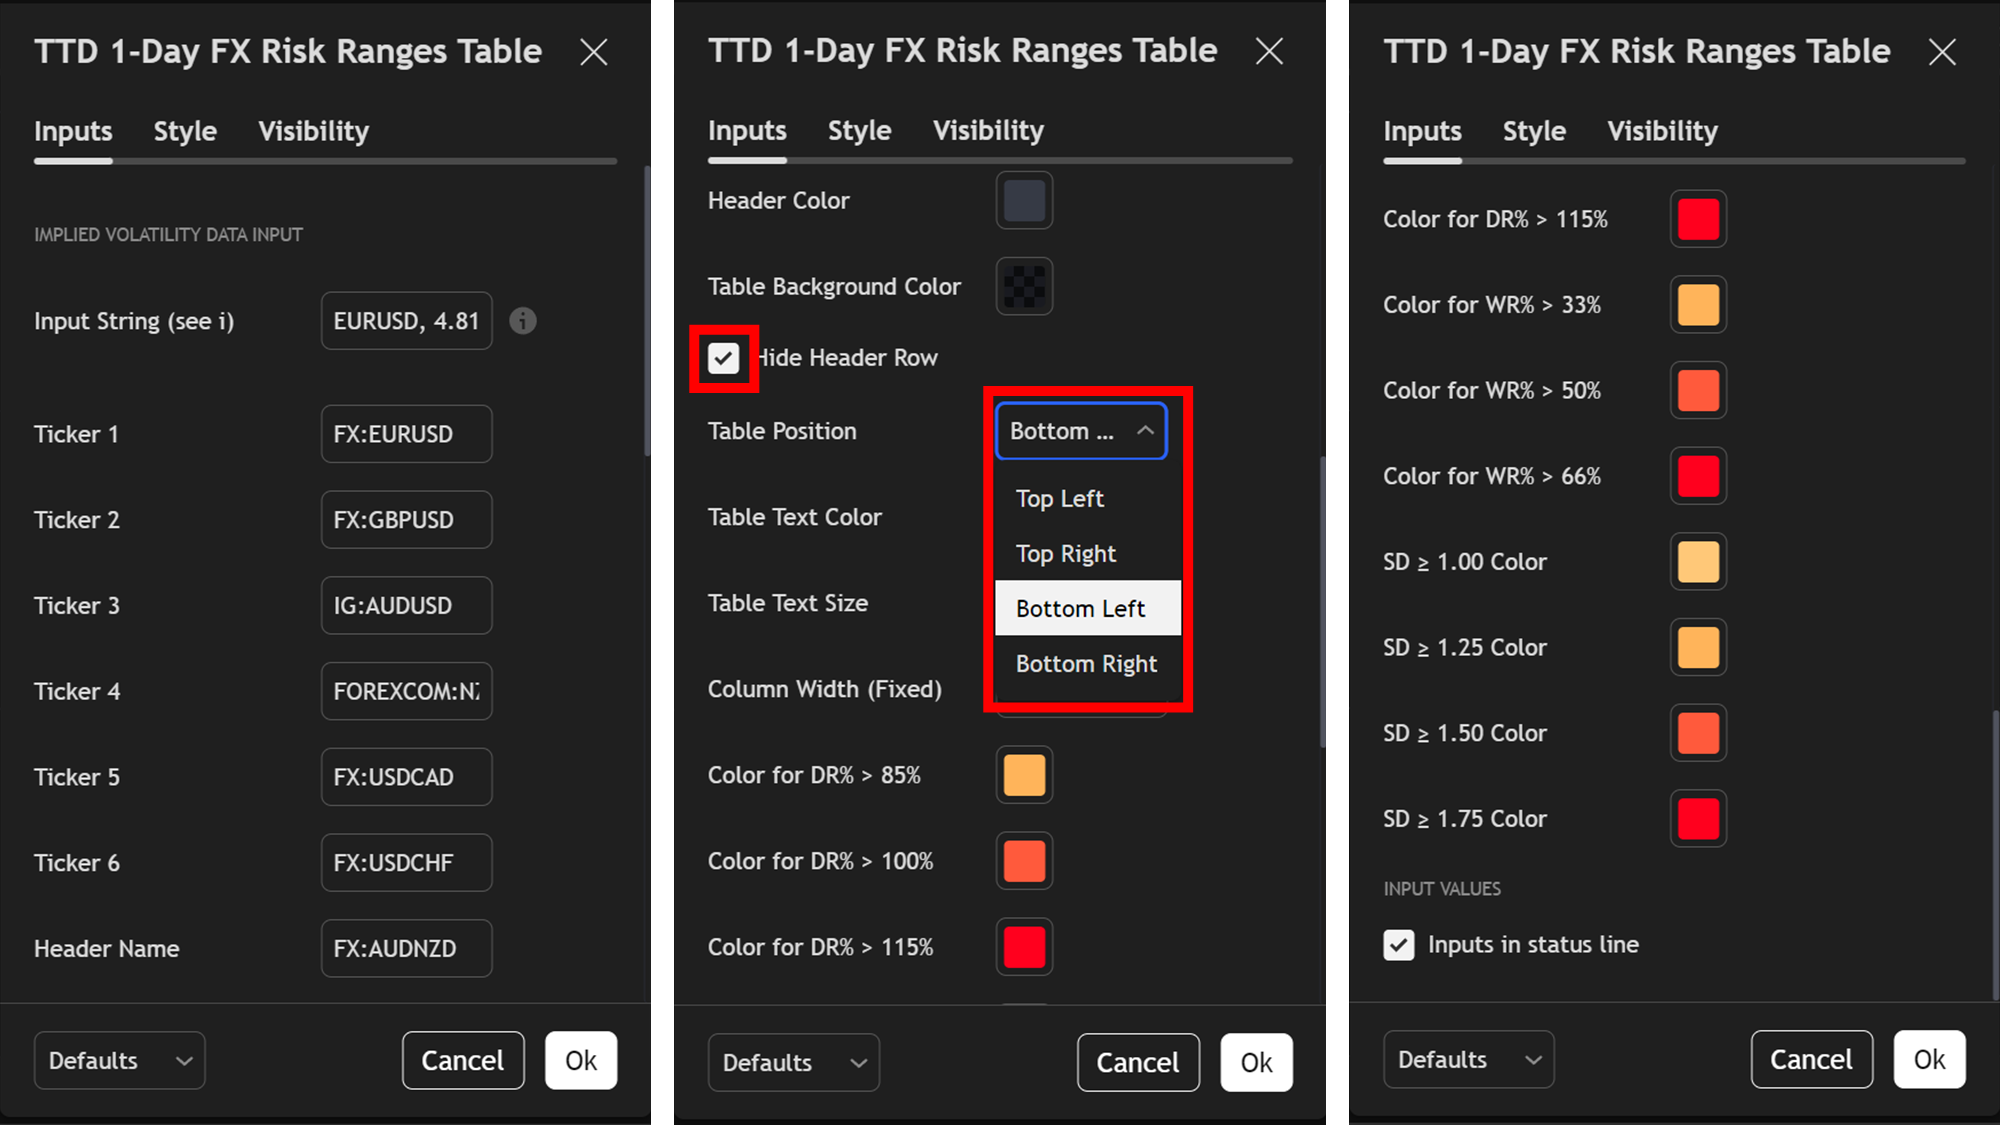
Tradingview does not have FX options data so the indicator needs to be manually updated with Implied Volatility values from external sources. We provide these daily in the TTD Discord for convenience and is easy to update as shown below.
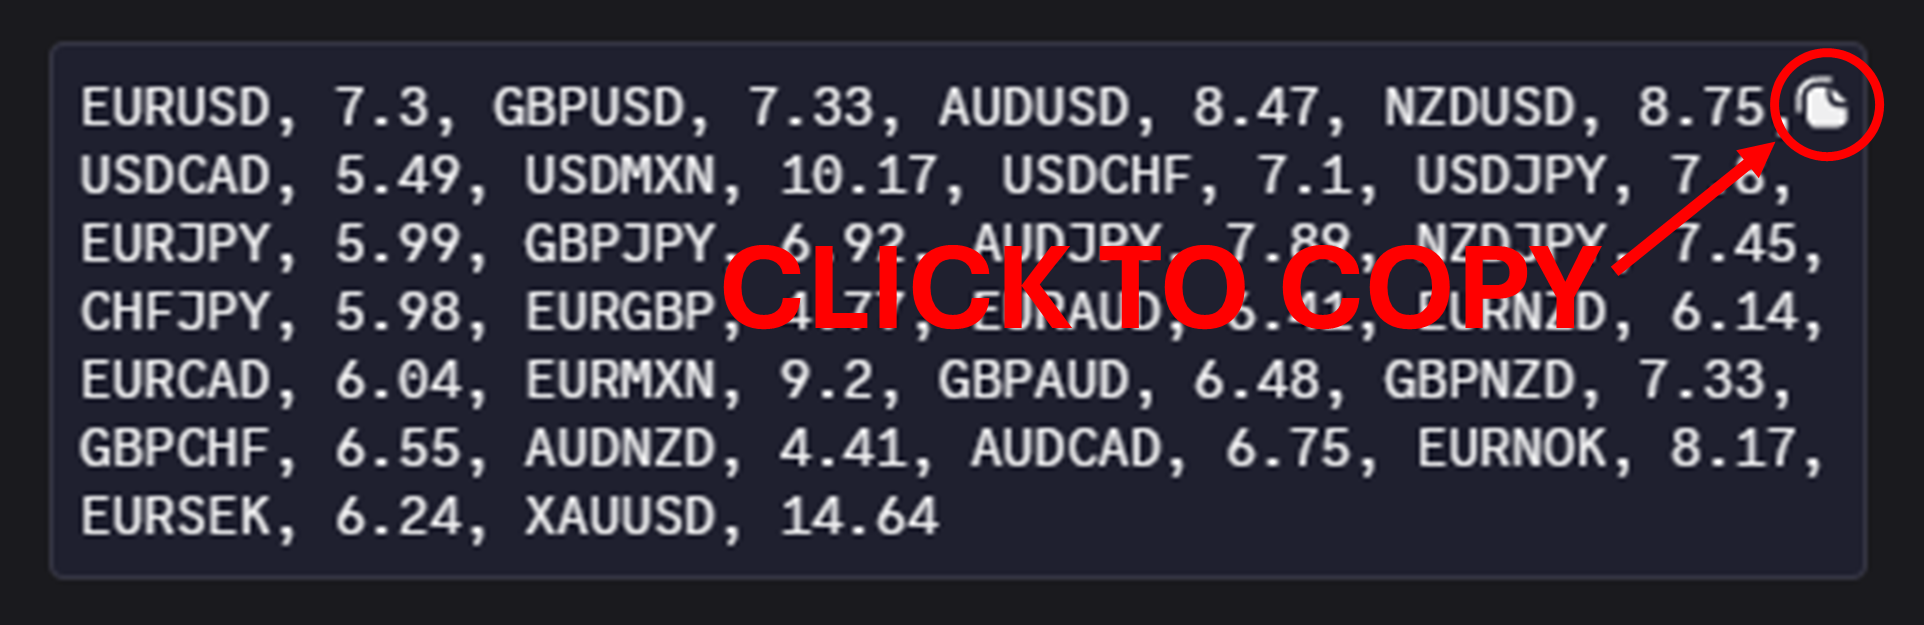
This is pasted into the "Data Input" box at the top of the indicator settings.
Note: it is not recommended to use the indicator on higher timeframes particularly above the "4h" timeframe as the indicator may incorrrectly display the wrong values.
Supplementary Indicator
In extension to the main indicator, there is also a supplementary indicator that can be used in a dashboard format called the TTD Risk Ranges Table indicator which you should be able to find it your invite-only script section of indicators.
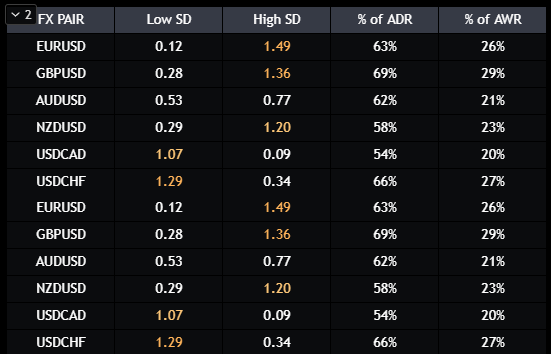
The above example uses the indicator in 2 instances in the same window pane, as a way to manipulate tradingview's limitations on the amount of tickers you can use for one indicator. This is done by setting the the "Hide Header Row" and "Table Position" settings for each indicator to visually extend the list.
Use Cases
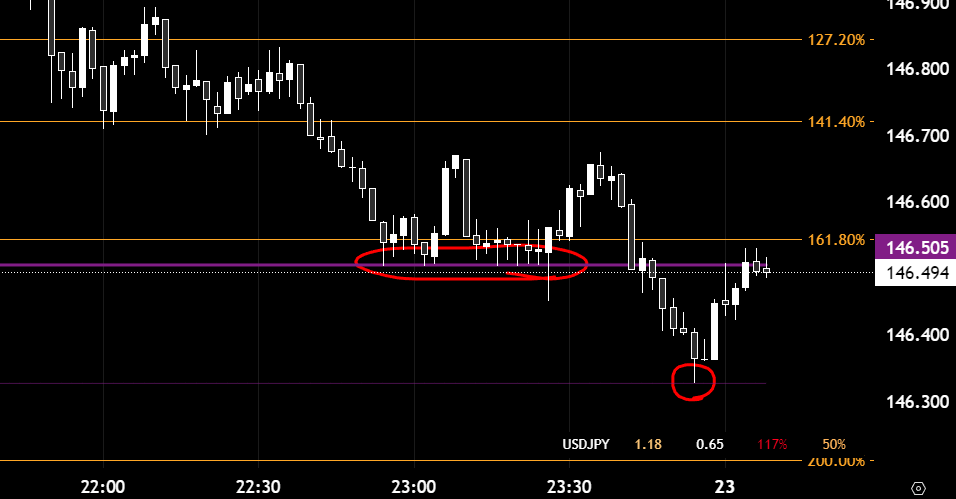
Earlier we touched on some differences in pricing conventions between Equity and FX options - namely the difference between the 252-day and the 365-day model. But while the 365-day model is the correct one to use for FX, we've had some interesting observations from our tests with respect to the 252-day based levels that we've decided to leave that option in.
Take for example this USDJPY chart which shows the selling stalling at the 365-day based level initially, then further sweeping those lows to the downside to put in a lower low and pivoting perfectly at the 252-day based level. This is one of many observations we've encountered with this indicator that drove our decision to include it despite those levels being derived using the non industry-standard 252-day method.
Using this indicator, and much like we can use the traditional strategies using the ATR indicator, we can often find good trade executions (or "entries) after a nice daily move. For instance:
- you've held a swing short trade and looking to take some profit - these 1SD-levels will have served as a guide on where to do that;
- you're looking to enter a long trade - you may look to enter at these 1sd levels, or to simply use them as reference to see how price behaves around these levels before executing;
- for day-traders/scalpers - the above example offered a few good scalping opportunities in that session making this a useful tool to add to your mean-reversion strategies;
- for stop-loss placements - whether for intra-day trades, 1/2-day trades, swing-trades, these indicator levels is an excellent guide for stop placements or how far you may want to trail your stops on longer-term trend positions.
Recommended Brokers
Daily close prices can differ quite substantially in some cases from one liquidity provider to another, particularly due to spreads widening to a large degree in the last minutes of a trading day. Given that the indicator levels are based on 2 main prices - the prior day close price, and implied volatilities (which we source from Reuters/Refinitiv), it is important to choose a TradingView broker feed with the least discrepancy to Reuters which we consider the benchmark for maximum accuracy - some background information on why below.
Reuters (now Refinitiv, owned by LSEG) is the primary platform of choice for FX at the institutional level. While Bloomberg is widely used by institutions, Reuters/Refinitiv maintains a primary role in live FX interbank transaction venues and price feeds. Deep integration with specialised trading platforms that offers liquidity aggregation, trade execution, and post-trade analytics trusted by banks, corporate treasurers, and institutional currency desks, makes Reuters the preferred venue for live FX interbank transactions and price discovery in the global FX market.
With that in mind, we compare recent close prices from Reuters/LSEG with that of 6 main CFD brokers available on TradingView and observe the following for Thursday September 25th Closing prices:
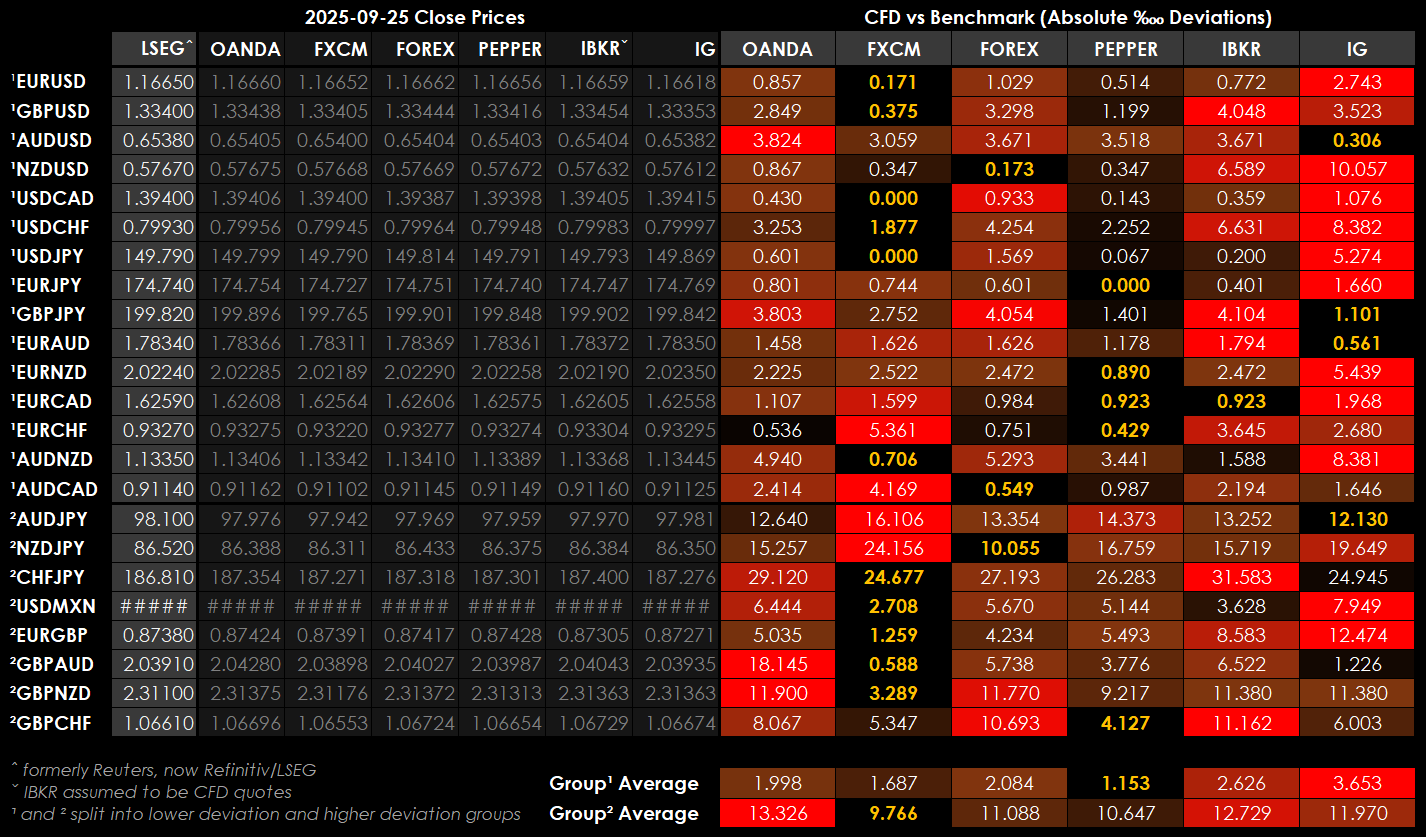
The above indicates FXCM and Pepperstone (having the least discrepancies against the Reuters/LSEG benchmark) to be the recommended broker price charts to use for the purpose of this indicator, while FOREX.COM and IG show much lower deviations than for a few FX-pairs.
These varying differences to the benchmark across various FX-pairs presents a challenge - there is no single liquidity provider that can be used reliably for the purposes of this indicator. We therefore attempt to assign the preferred broker for each FX-pair according to their lowest 4 week-average of daily per mille (‱) deviations from the benchmark as of the week ending 2025-09-26.
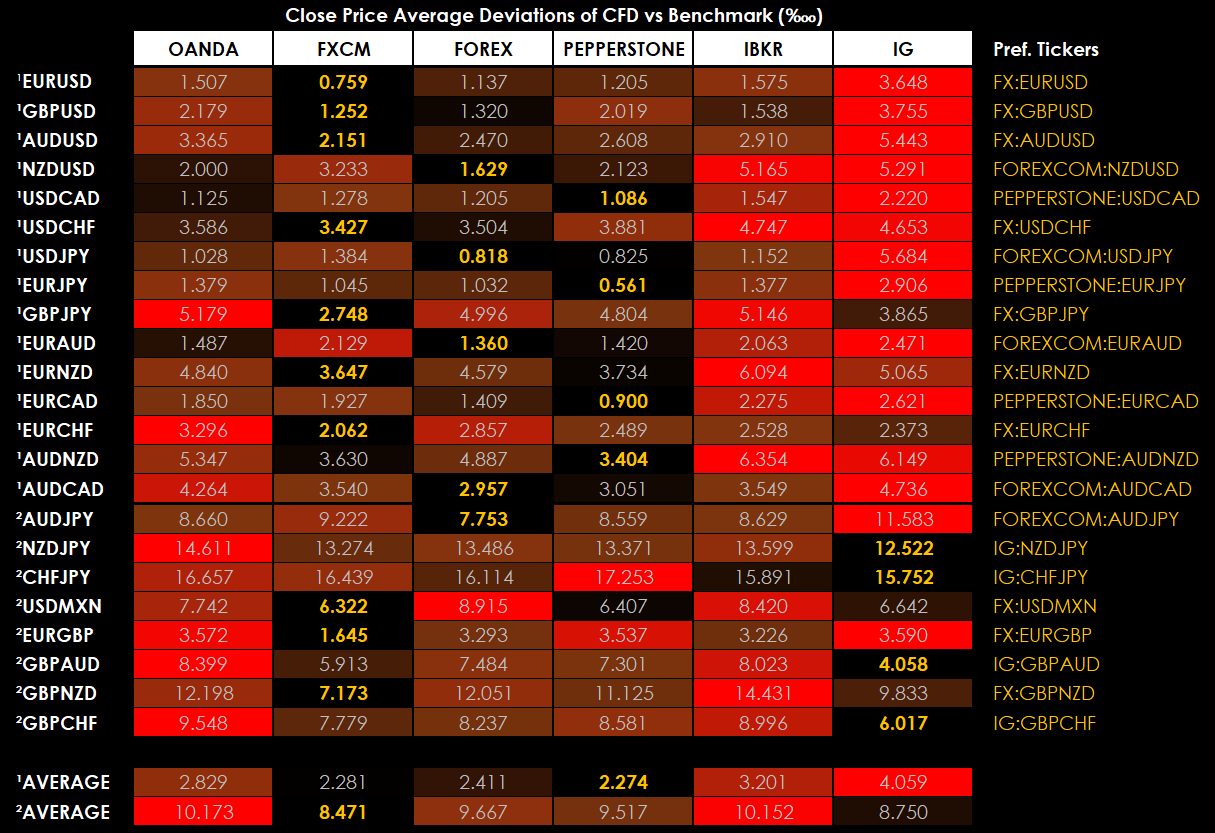
FXCM and Pepperstone maintain the lowest average deviations overall, but there are a few instances where FOREX.COM and IG have significantly lower deviations for some FX-pairs. We therefore recommend a set of Preferred Tickers (with the smallest deviations from the benchmark for a particular FX-pair listed down the right-hand side column) for maximum accuracy.
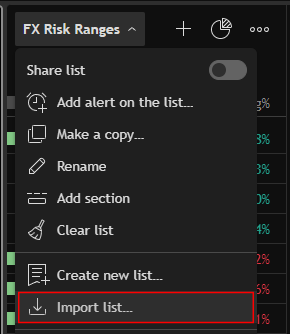
For convenience, we suggest downloading the text file to import into TradingView so you can keep a watchlist of tickers set to the recommended data source (broker) for the purpose of this indicator.
'SPX RISK RANGES' INDICATOR
Practical Uses
This indicator allows traders to gauge how stretched or outsized intraday moves are relative to how much volatility was priced in by the market. The modern trading environment is heavily dominated by options trading. For instance at the end of Q2 2025, the CBOE reported several new records in SPX option trading volumes:
- Quarterly SPX options record of 3.7 million contracts
- Quarterly SPX 0DTE (zero-days-to-expiry) record of 2.1 million contracts.
- Monthly SPX 0DTE record of 2.2 million contracts.
As the use of SPX options continue to push to record levels, the price action of the primary market is increasingly influenced by options market activity. This is because market makers (option-writers/sellers) will often hedge their short-option exposures via the primary/underlying market. As a simple example, if the call-options they have sold go up in implied volatility (the option prices), they would buy assets to hedge their exposure, and would unwind those hedges as the buyers unwind or monetize their option positions. This is why the options market massively influences the day-to-day flows in the primary market, thus making this indicator a useful tool for traders.
Expected Move for SPX
Just like we use 1-day (overnight) implied volatility to calculate the risk ranges for FX, we use the SPX 1-day implied volatility to calculate the daily risk ranges for S&P500. Note that while the indicator will load on the SPX-cash CFDs and ES, this should be used on the main SPX index chart for maximum accuracy, as the cash close can greatly differ with SPX-derivatives depending on after-hour activity.
Indicator Features and Uses
This indicator is fully functional on its own, unlike the FX Risk Ranges indicator which requires the options data to be imported manually from external sources. This is because we can use the CBOE's 1-day implied volatility which is quoted on TradingView. Like the FX Risk Ranges indicator, the SPX version also plots the ±1SD and ±2D lines on the chart.
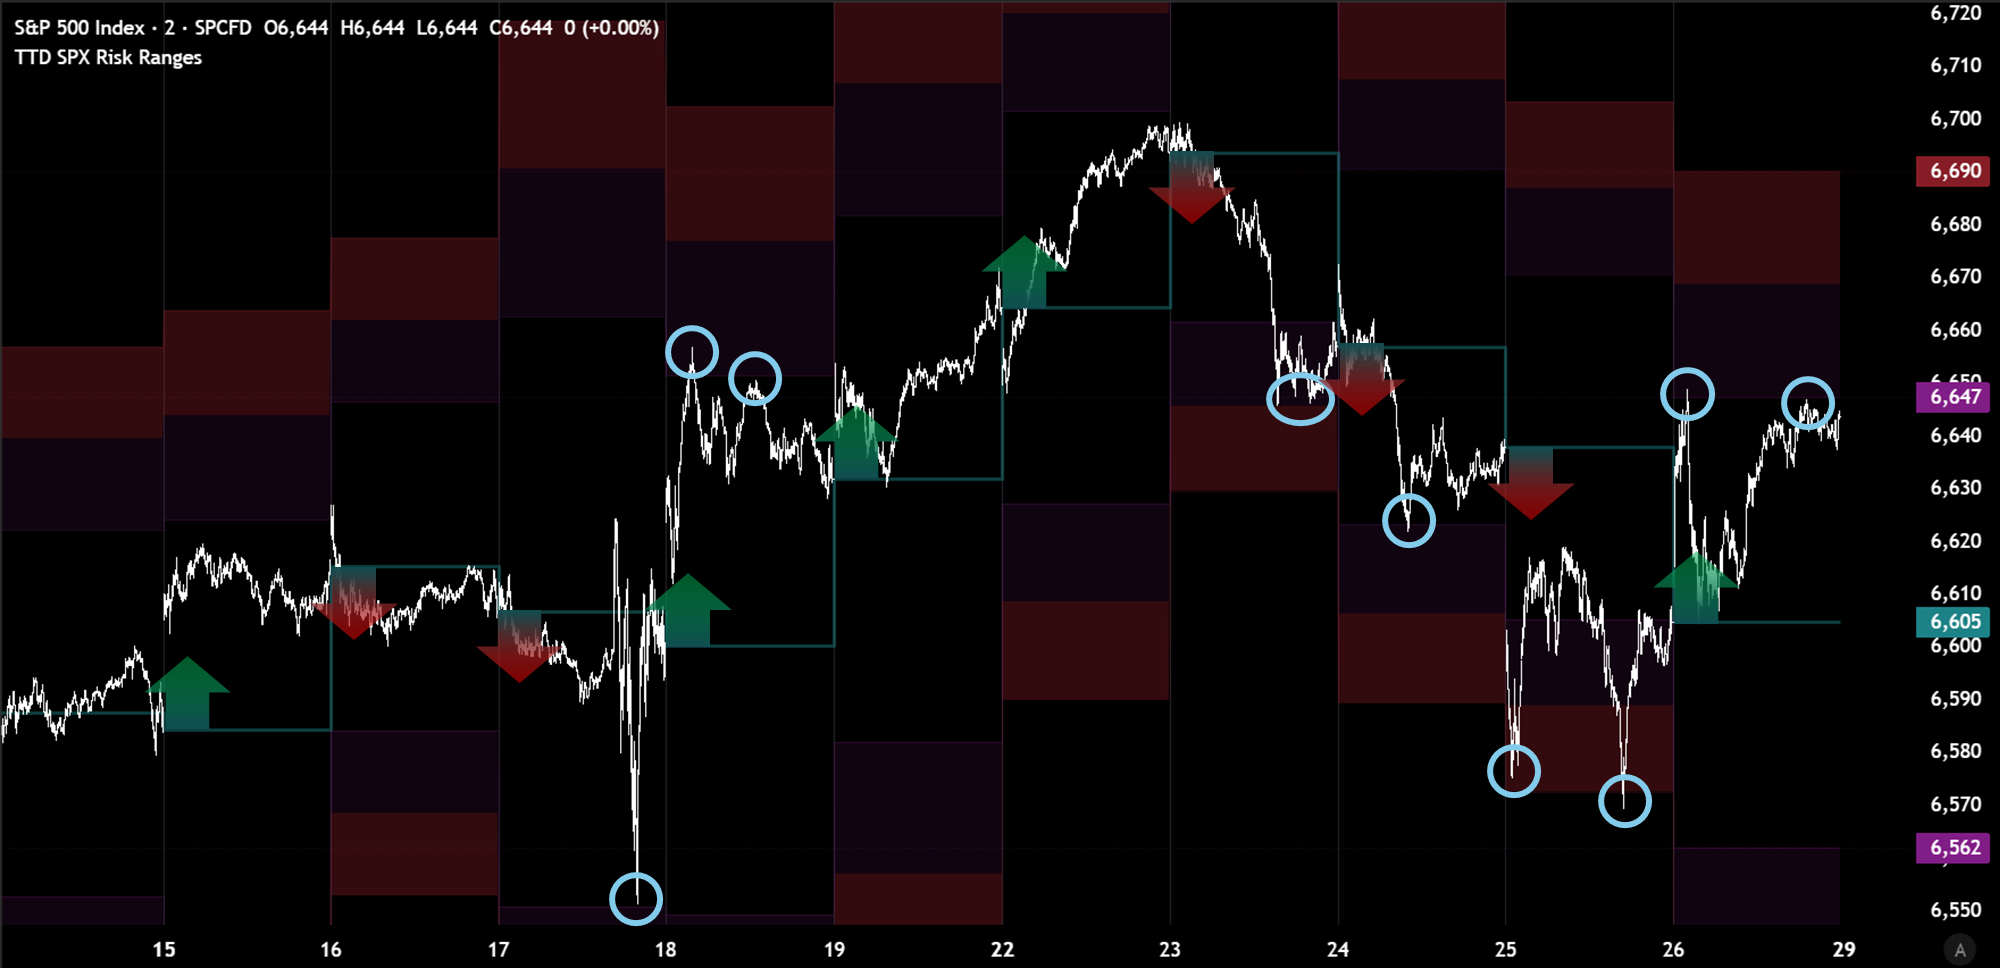
Concepts and practical use cases outlined earlier are virtually the same. Prior close levels and Opening ranges are good guides for intraday trading biases, and price extensions that exceed their expected 1-standard-deviation moves will be where options become profitable to monetize and therefore where we see a tendency of those flows reverse and the price action often reversing.
These indicators are only accessible to TTD members via invite-only.
If you are a member, but do not have access to either "TTD FX Risk Ranges" or "TTD SPX Risk Ranges" indicators, please DM us in the Discord with your TradingView user name.
If you have any questions at all, you know where to find us. See you in the Dojo!


![Week52 MacroTechnicals - Santa Claus is coming to [low-vol] town](/content/images/size/w600/2025/12/ARTICLE-Macrotechnicals-FINAL-01-2.png)